Instructional Design for a Blended Learning Course for Introduction to Data Analysis

Level of Instruction: Advanced Level Curriculum – Post Secondary or High School and Pre-University Educational system. This is equivalent to Year 1 in college in the United States.
Intended Audience: Advanced level Students.
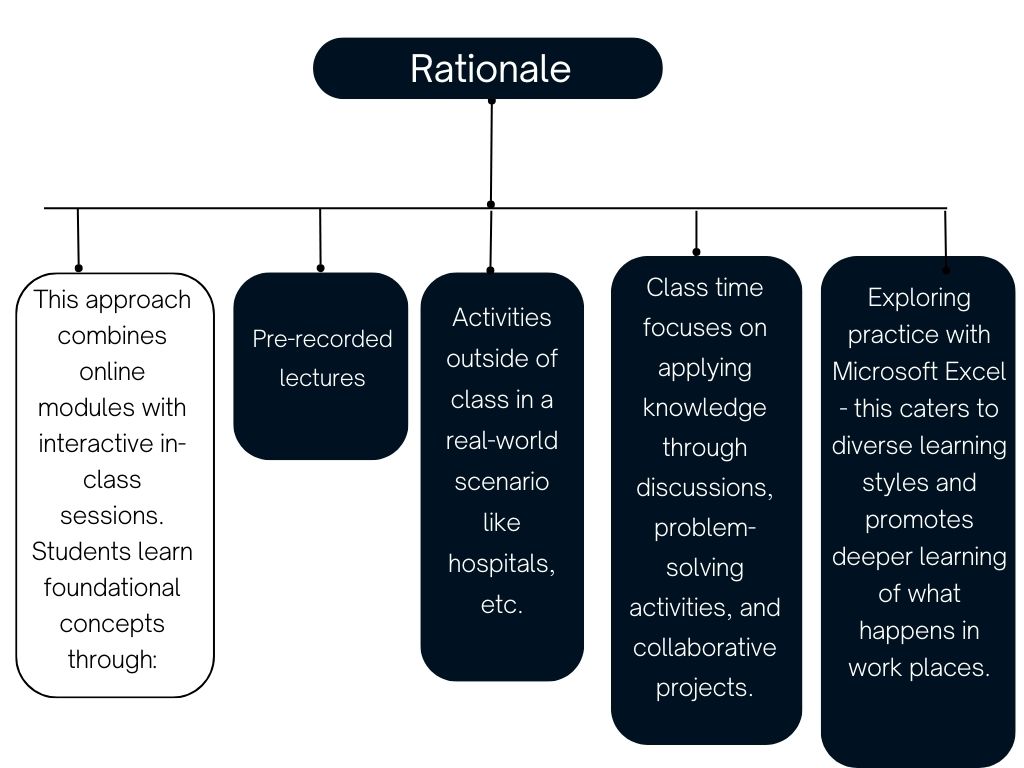
Design Approach: Blended Learning with a Flipped Classroom Model
Who Controls the Learning?
This design adopts a shared control approach. The instructor provides guidance and structure but empowers students to take ownership of their learning through:
- self-paced online modules,
- group project work with presentations, and
- Independent research.
Instructional Design Model: Outcome-Based Education (OBE)
- Rationale: OBE focuses on what students will be able to do by the end of the course. This aligns well with the desired learning outcomes of applying data analysis skills in the real-world contexts.
- Hence students can apply their knowledge when they go for internships in business organizations, healthcare institutions and other sectors.
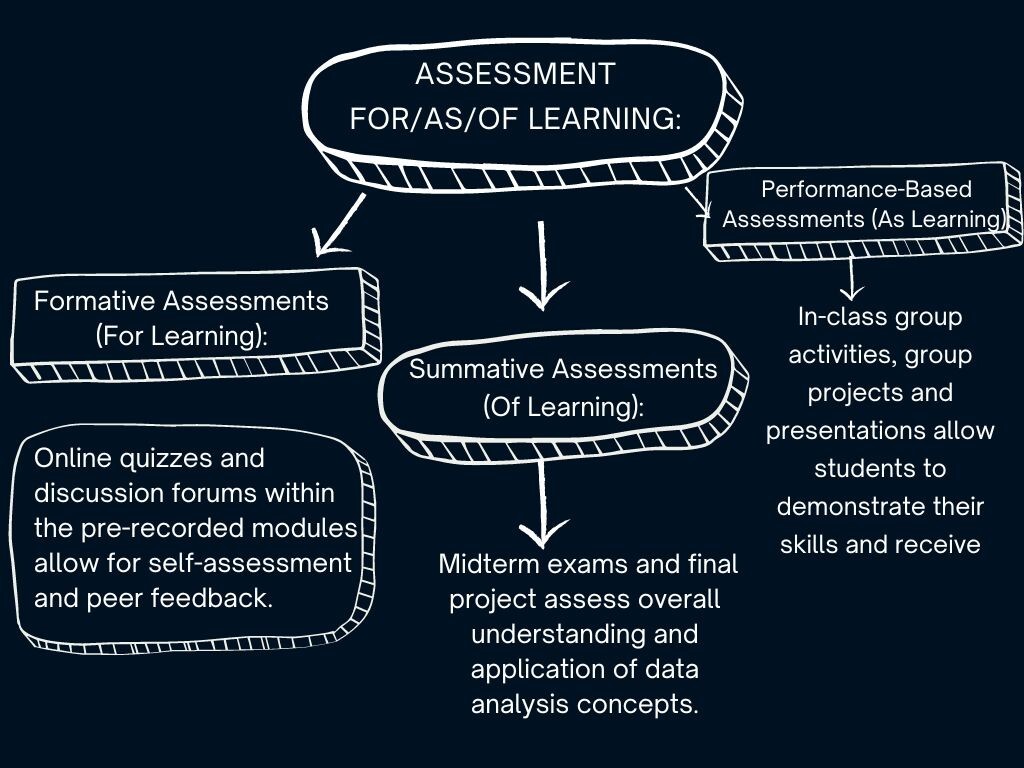
Assessment for/as/of Learning:
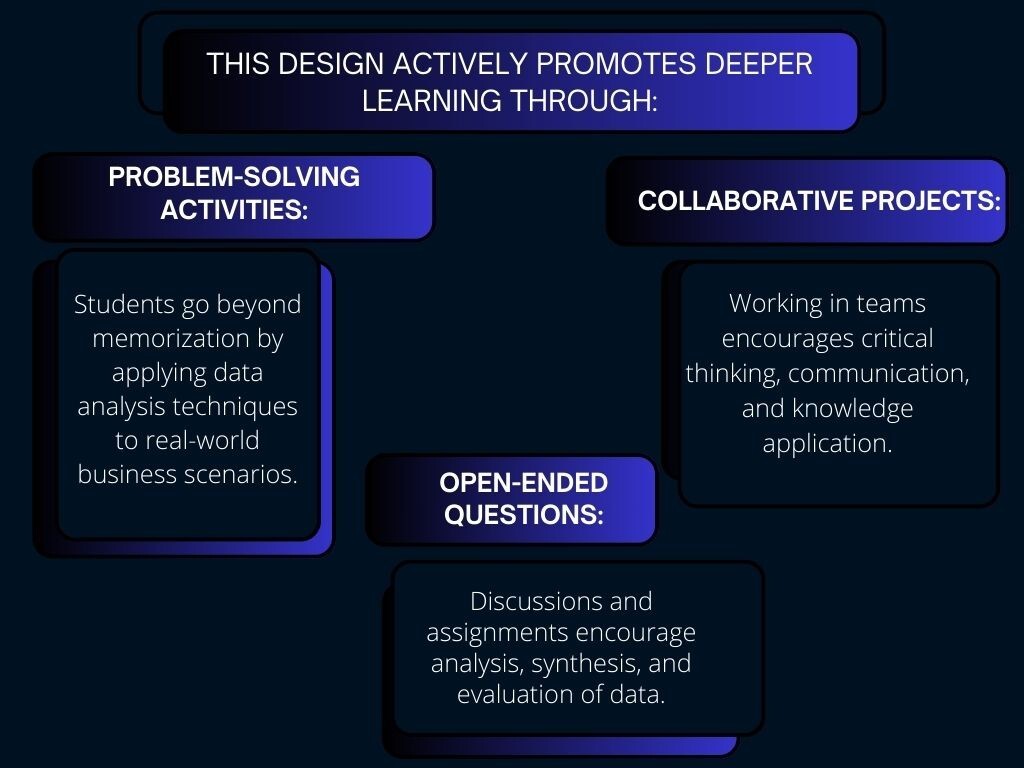
Moving Towards Deeper Learning:
Sample Design Map (3-Column Table):
| Learning (Goals) Outcome | Learning Activities | Assessment Strategies |
|---|---|---|
|
Foundational Knowledge: Students will be able to interpret and describe various data visualizations (e.g., bar charts, scatter plots). |
Online module: Video lectures, interactive visualizations, self-assessment quizzes. |
Online quiz, in-class discussions analyzing real-world data visualizations. |
|
Application Students will be able to calculate and interpret basic statistical measures (e.g., mean, median, standard deviation). |
Online module: Video lectures with practice exercises, collaborative online forum discussions. |
Midterm exam, in-class group activity analyzing a business dataset using statistical measures. |
|
Integration Students will be able to apply data analysis techniques to solve business problems and communicate findings. |
Case study project: Analyze a real-world business scenario using data analysis methods, create a presentation summarizing findings and recommendations. |
Final project presentation, peer evaluation, instructor feedback. |
|
Human Dimension: Self: Reflect and self-evaluate based on their beliefs and based on their learning Others: Share their learning experience and process with others |
Online module, case study project, and application of practices to real world Collaboration, group discussion and group work evaluation |
Self review, development of a learning philosophy Review group work, project and do group evaluation |
|
Caring: Develop a tutoring and coaching plan for supporting other learners. |
Develop learning plan for mastering data modulations and visualizations |
Review the final Tutoring, study and coaching plan |
|
How to Keep Learning: Develop a framework for learning data analysis and visualizations. |
Building up the framework and data models for data analysis and visualizations |
Review the final framework and model for accuracy and consistency |
Building up the framework and data models for data analysis and visualizations
- Week 1-2: Develop and upload online modules for Units 1 & 2 (Data Visualization, Descriptive Statistics).
- Week 3: In-class session focused on applying concepts from modules 1 & 2 through guided activities and discussions.
- Week 4-6: Students complete online modules and assignments for Units 3 & 4 (Inferential Statistics, Hypothesis Testing).
- Week 7: In-class session focused on applying concepts from modules 3 & 4 through case studies and group work.
- Week 8: Midterm exam (combination of multiple-choice and short answer questions).
- Week 9-12: Students work on case study projects in small groups, utilizing online resources and instructor consultations.
- Week 13: Final project presentations with peer evaluation and instructor feedback.